What do we measure?
Spectroscopy, visual and UV, is often used to measure absorption and transmission. This allows us to measure concentrations of substances in solutions or the properties of materials from their reflection or transparency. However, what we want to measure is emission. Light emitted by minerals that are exposed to UV fluoresce as a result. We therefore need no light except our UV source, or more commonly: excitation source. In fact, we must try to avoid all the light that does not come from the fluorescence. We are therefore obliged to measure in the dark. The easiest way to do that is to do measurements in a dark cell. Very expensive, such a large cell, but you can also make one yourself from eg. a bread box... Paint the inside black and drill a few holes in strategic places, a wall socket as a holder for the probe, and there you have it: a usable measuring cell. Cost price: less than €70.00.
.jpg)
Spectrometer
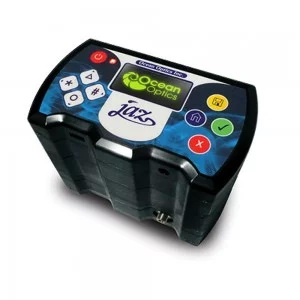
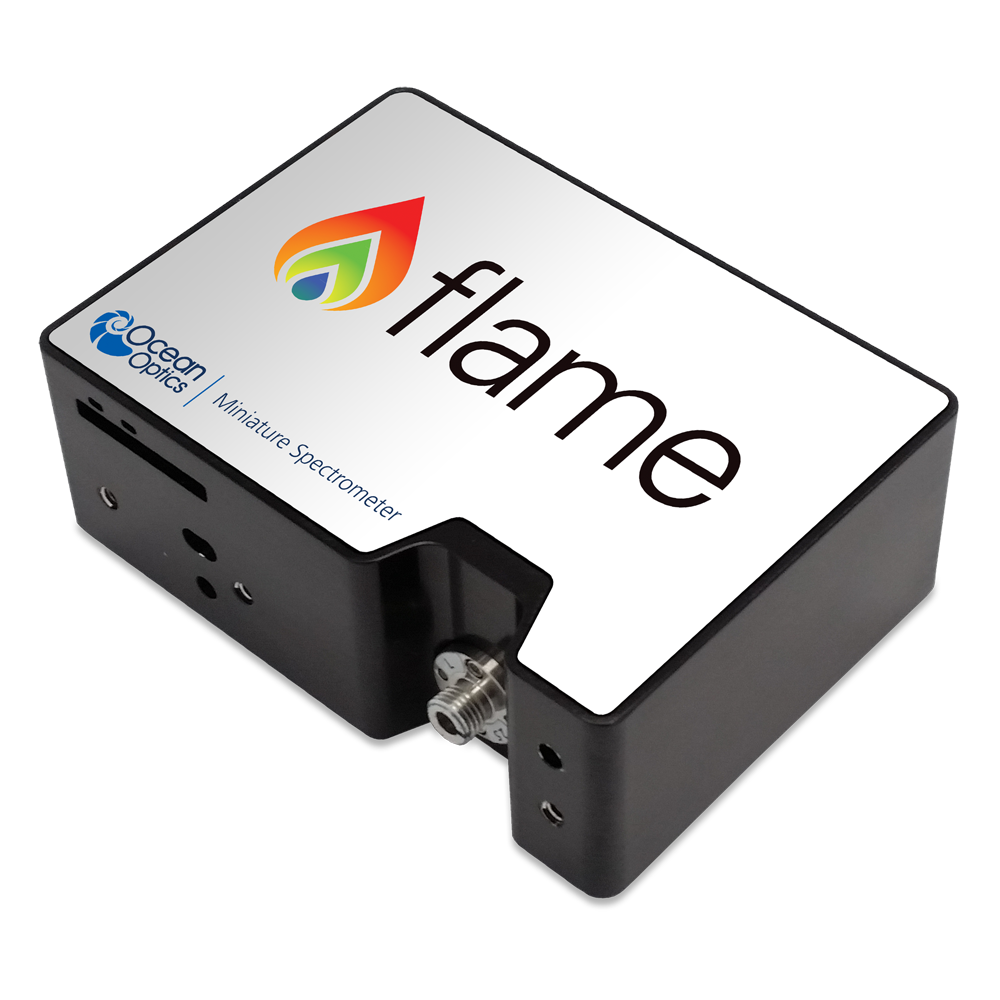
Small spectrometers that work via USB have become reasonably affordable nowadays. The MKA has purchased an Ocean optics JAZ spectrometer. I personally have acquired an Ocean optics flame. Both devices have an "extended grating", which allows them to measure a very broad spectrum: 180 nm to 1080 nm. The JAZ CCD array has more pixels but is very sensitive to temperature rise of the sensor. In case of longer integration time, the background measurement can become invalid. The flame spectrometer is much more stable but has fewer pixels. Both spectrometers can be fitted with another slit in less than a minute, which allows us to measure both very strong and very weak fluorescence with the highest possible sharpness.
Our DIY dark cell with probe, spectrometer, and light source
Light sources
Spectra tell us a lot about the analysed substance by analysing the spectral peaks. What is their position, intensity and width? Those are the things that can tell us why a mineral fluoresces. However, when we generate the necessary UV with mercury arc lamps, we will inadvertently introduce the spectrum of mercury in our measurements. That is a real pollution that we do not want. Therefore, we try to work exclusively with LED sources and laser diodes. They have narrow emission peaks and deliver a clean spectrum.
A light source with different wavelengths is indispensable. This home-built source has a white led on board and led UV sources of 305, 375, 400, and 410 nm. Also a 532 nm green laser for detecting eg. Chromium and neodymium is built-in.
Collecting light
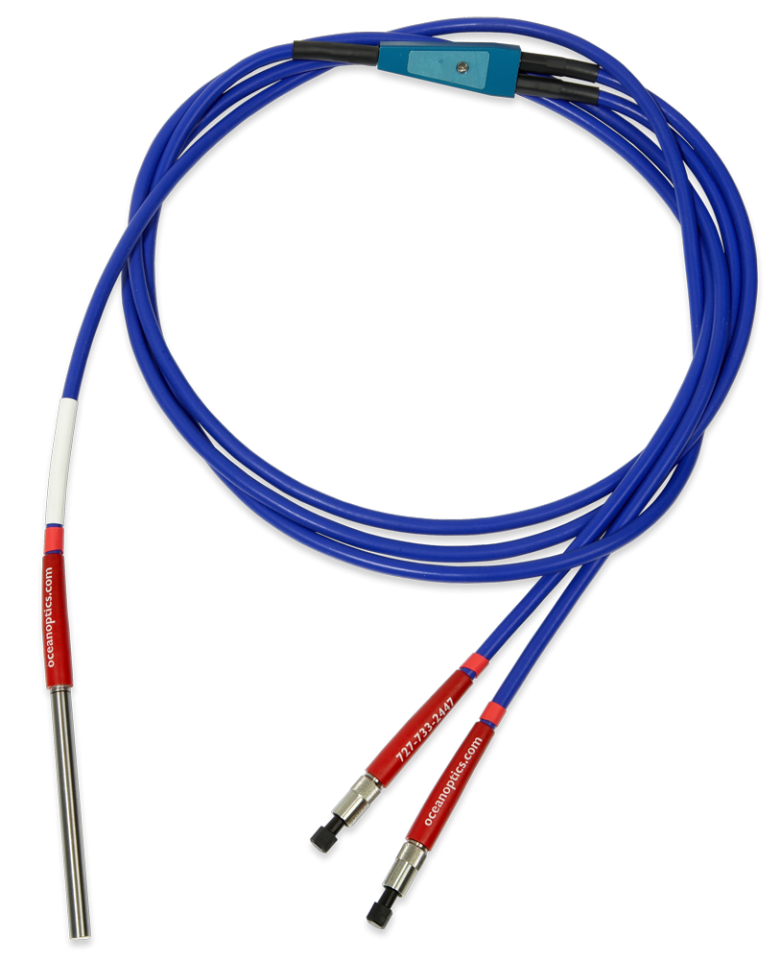
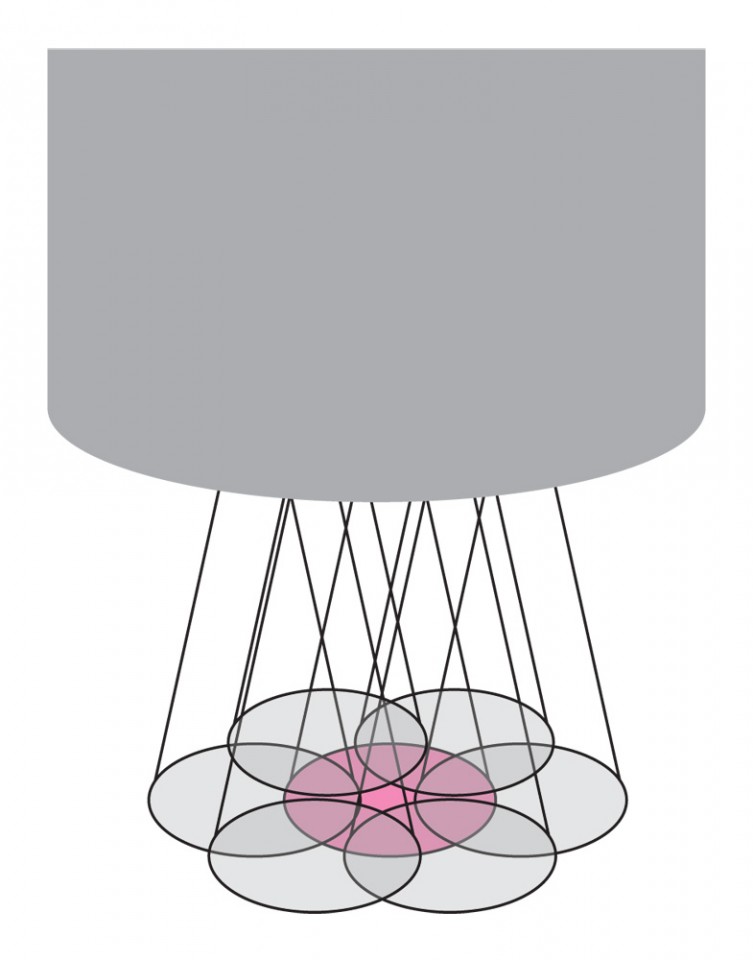
The light of our fluorescent minerals must of course be led to the spectrometer. A fiber optics is the ideal medium for this. We bought an Ocean optics back scattering/reflection probe. That's a fiber optic cable that splits into a Y shape. A leg of the Y is screwed onto the UV LED with a SMA coupling. Hence the UV goes through the fiber to the tip of the common leg of the Y. The fiber splits into six thinner wi
res that are positioned symmetrically around the center of the tip. In the middle of the tip the "measuring cable" leads to the other leg of the Y. We then link that to the spectrometer. This way we are always sure that what we measure is also exactly in the UV-lit spot. The probe also allows us to measure very small surfaces, say 2 mm ².
Wavelength calibration
If you want to be able to use the spectral peaks to recognize activators, you need to ensure that the spectrometer knows on which pixel a particular wavelength should fall. We do this by means of a mercury-argon calibration lamp. Hg and Ar combined have a number of spectral lines that include virtually the entire spectrum, from short-wave UV to far into the red. To calibrate the spectrometer you have to manually recognize the peaks and, in an Excel file, allocate these peaks to the sensor pixels that see them. You then unleash the Excel solver on these numbers. Excel gets you the coefficients of a sixth degree polynomial. You can then upload these coefficients to the EPROM in the unit. From then on you have the right relationship between pixel and wavelength.
Need for absolute Calibration
To get a good spectral dispersion you need to use a refraction grating whose properties are exactly suitable for the spectral region you wish to investigate. Two things are important: the number of lines per mm (n) and the angle of those lines are relative to the surface of the grid. The larger n, the greater the dispersion. More dispersion means a greater resolving power, but also a narrower part of the spectrum. If you want to see a wide area and still want to have a good separation you have to choose an extended range refraction grating. WIth these gratings n is variable (e.g. 300 to 600 lines/mm). Each value of n is accompanied by a 'blaze', an area where the efficiency of the grid is the highest. With a variable line refraction grating, you will also have several blazes. When interpreting a spectrum, you must take that into account. The best way to go about that is to measure the spectrum of a calibration lamp. This is a lamp of which you know the spectrum because the manufacturer has calibrated it professionally. You can calculate what corrections need to be made to compensate for the blazes, and other instrument peculiarities, based on that well-known spectrum.
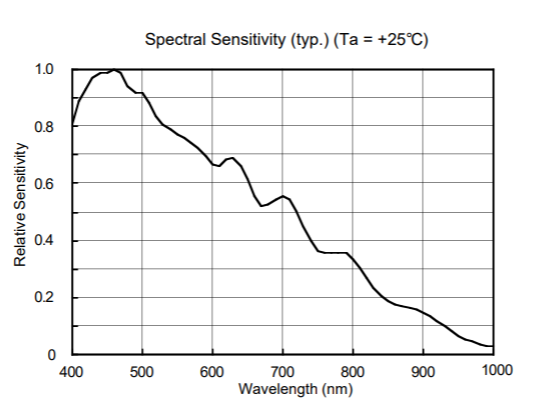
Features of CCD sensor
The sensor array of our spectrometer is not equally sensitive to all wavelengths. You have to compensate for that so that the signals of different wavelengths are ' treated equally '. This is one of the reasons that we need to perform absolute calibration.
The sensor array of our spectrometer is not equally sensitive to all wavelengths. You have to compensate for that. Image courtesy by Ocean Optics
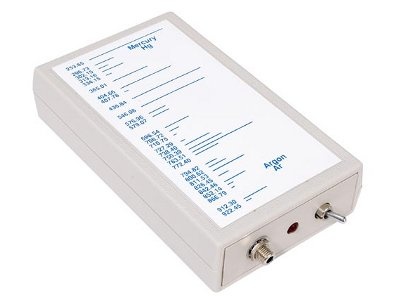
Mercury-argon calibration lamp HG-1
Photo courtesy by Ocean Optics
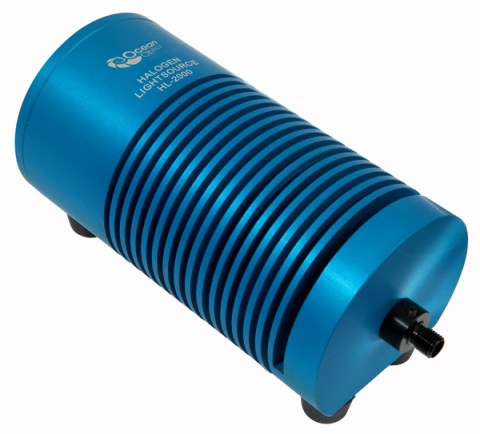
Halogen calibration lamp
Halogen lamps produce, within certain limits, a spectrum corresponding to a thermal radiator. If such a lamp has a color temperature of roughly 2800 Kelvin, then the light corresponds to a Planck spectrum of an object with that temperature. The power supply of the lamp has been stabilized so that fluctuations on the mains voltage do not result in fluctuations in the color temperature. Such a lamp allows us to calibrate the spectrometers for the area between 380 nm and 750 nm. You then correct for blazes of your grating, the efficiency of the sensor array, and also for effects resulting from the use of different glass fibers, input slits, etc. So it is important that you calibrate for each set-up that you intend to use. We have therefore made a calibration for measurement with the back scattering/reflection probe for each entrance slit we have: 5, 25, 100 and 200 µm and that on the two spectrometers we use. You also have to be careful that you always use the correct calibration file that fits the arrangement with which you measure.
Corrected results
If we have not performed an absolute calibration, we have to manually interpret every spectrum! What is a real peak and what should be seen as a tool error? This complicates the interpretation of spectra enormously. For example, if you have a blaze that falls between 600 nm and 610 nm, you'll see a peak or bump there. This is a massive stumbling block because a few important emissions of Sm3+ are found precisely on those wavelengths. It is therefore important to use the proper correction! The best way to measure spectra is as ' Absolute Irradiation ' and for two reasons. First, you can do that only if you have performed a calibration. The spectrum is thus cleaned up automatically within the ' valid area ' of the calibration. All the bumps and spikes that come from the instrument and the glass fibres used are removed from the spectrum. Secondly, an at least equally important reason is that you measure in the ' energy space ' and not as relative light intensity per wavelength. Why is that important? Well, a blue photon has significantly more energy than a red one. That follows from the fact that the wavelength λ is inversely proportional to the energy. The smaller the wavelength λ, the larger E becomes. The energy distance of eg. 10 nm is therefore larger between say 400-410 nm than between 700-710nm. It is always about 10 nm but the energy-gap between them differs. If you measure in Absolute Irradiation, you measure the power in micro-Watt per square centimeter emitted by your specimen for each wavelength. Your result is not in ' counts ' but in µW/cm ²/nm. This will make your spectrum look quite different. The disadvantage of this method is that parts of spectra that are close to the boundaries of the calibration area are often very disturbed by noise. Theoretically, the calibration with a halogen lamp is valid from 380 nm to 850 nm. In practice, however, you are limited to measurements between 415 nm-750 nm.
If you want a broader calibrated area, so you can also look far into the UV, you have to have a combined halogen/deuterium calibration lamp. However, this is rather heavy on the budget... It costs a few thousand Euros. However, it allows you to make better assumptions about activators that radiate in the blue and UV area. For the time being, this calibration lamp remains a pious dream.
Software
Currently we use Ocean Optics ' Ocean View’ software for measuring spectra. It is modular and has tools for different types of spectrometry.
To graphically display spectra and to perform calculations on them (normalization, error correction, calculation of Gaussian components of a spectrum, etc...), I have has purchased the Magic Plot Pro program.
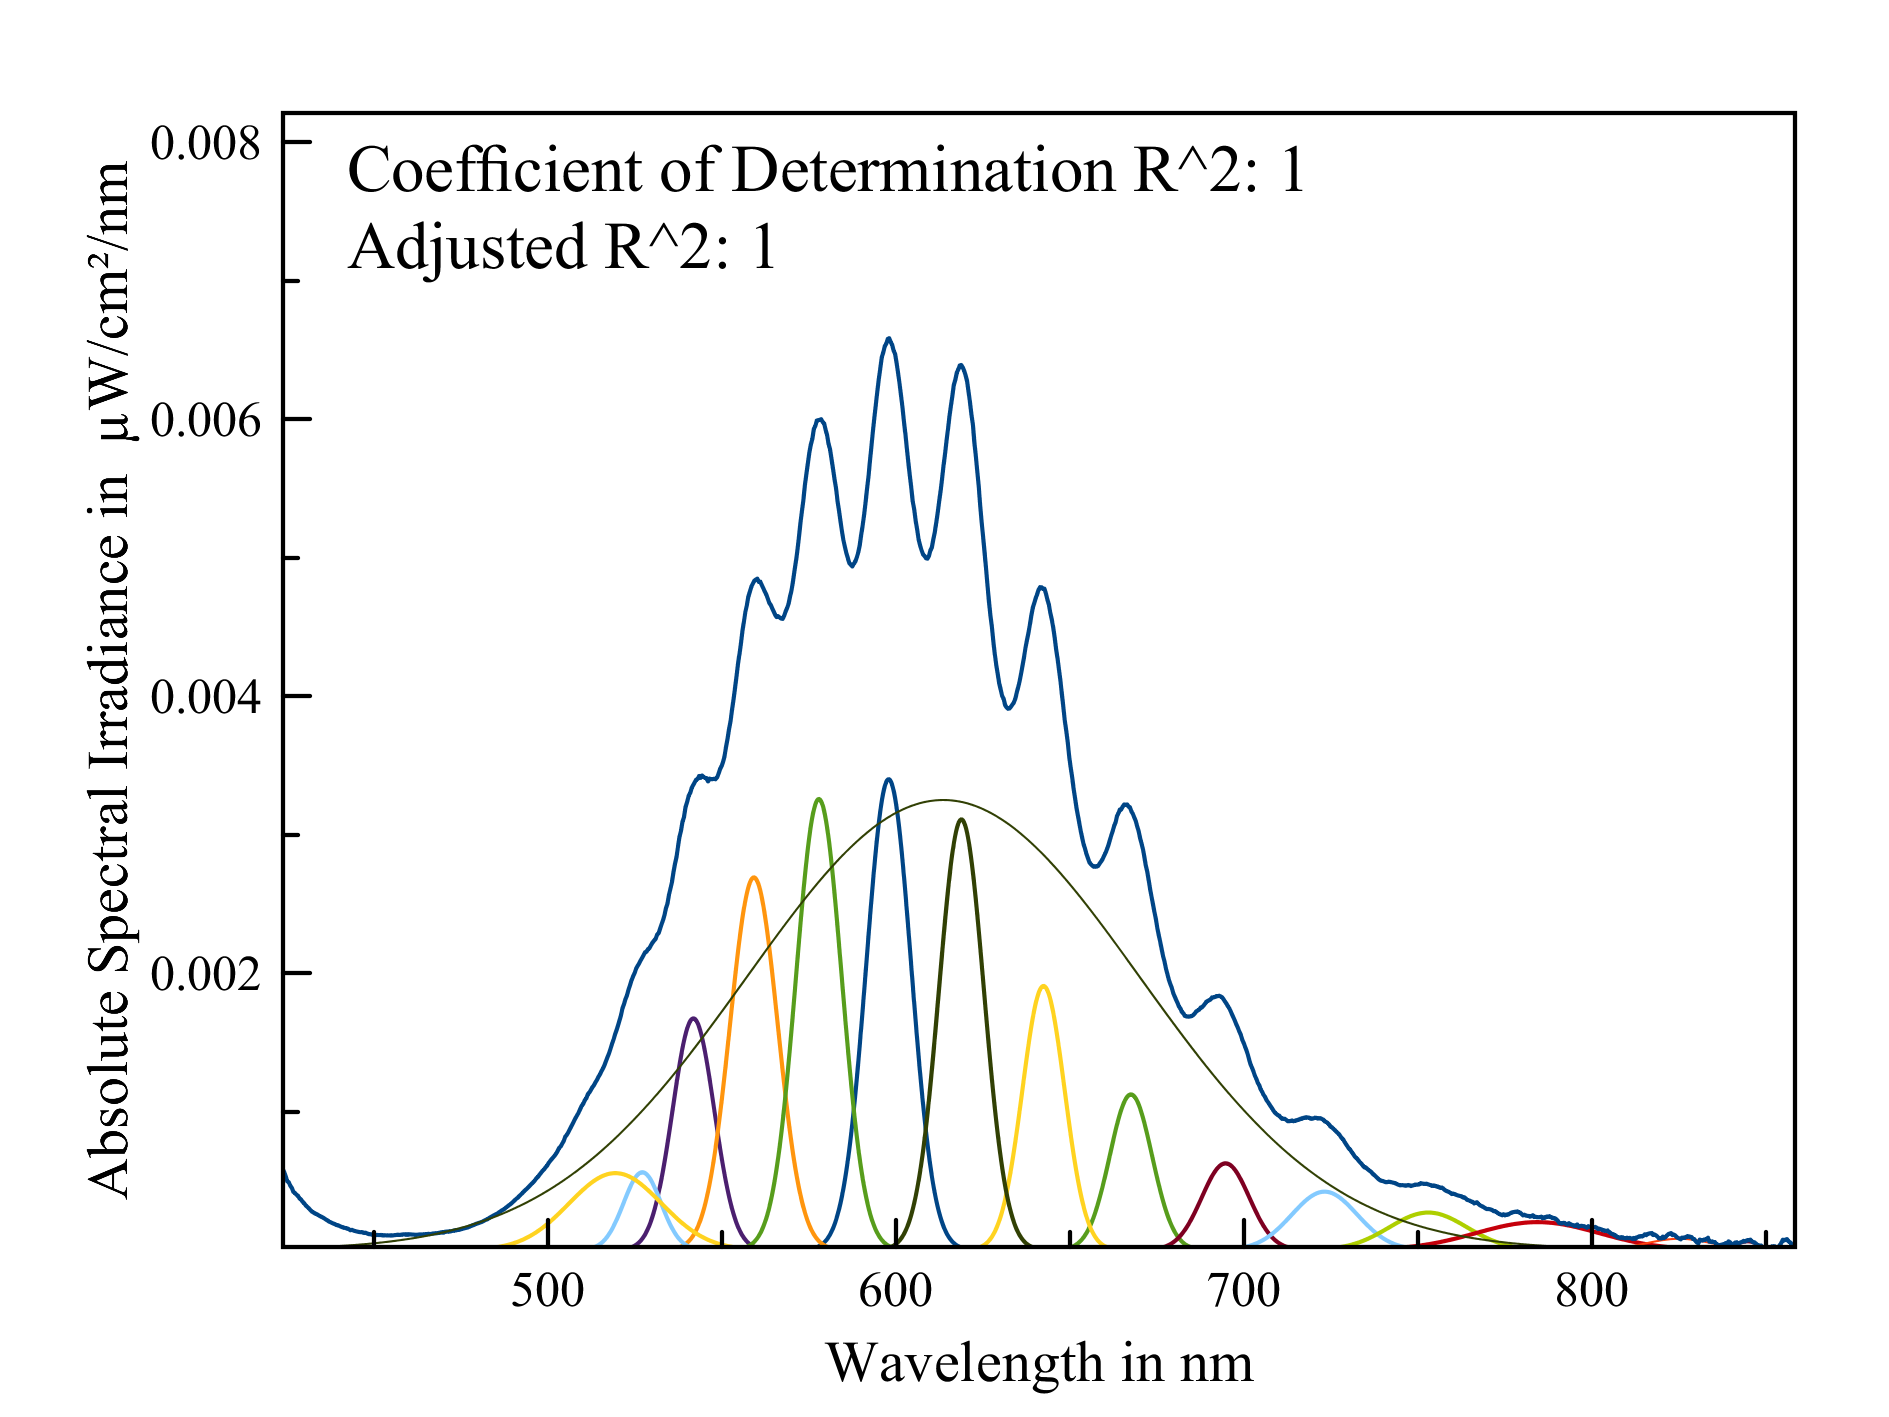
Spectrum of the emission of the disulfide ion in Marialite. The vibronic emission is perfectly resolvable in its Gaussian components, provided that you measure it as absolute spectral emission.
Photos courtesy by Ocean Optics
Photos courtesy by Ocean Optics
Halogen calibration lamp
Photo courtesy by Ocean Optics
.jpg)